


Secure and Easy to Use Interface using any Browser
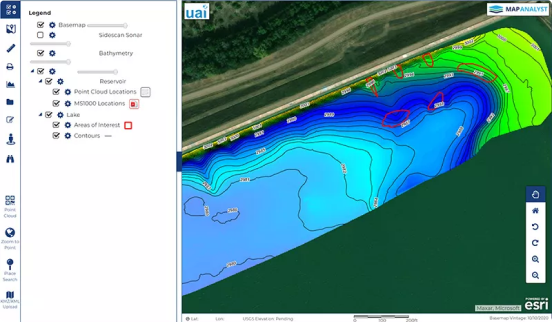
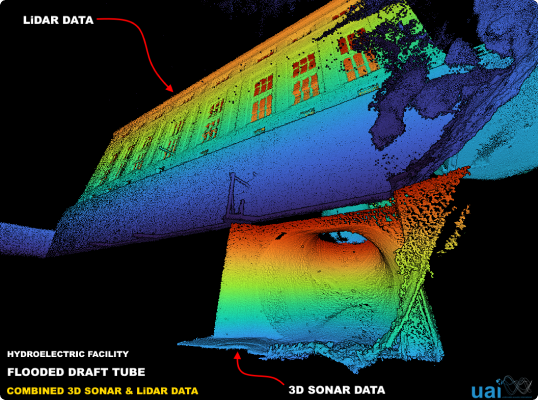
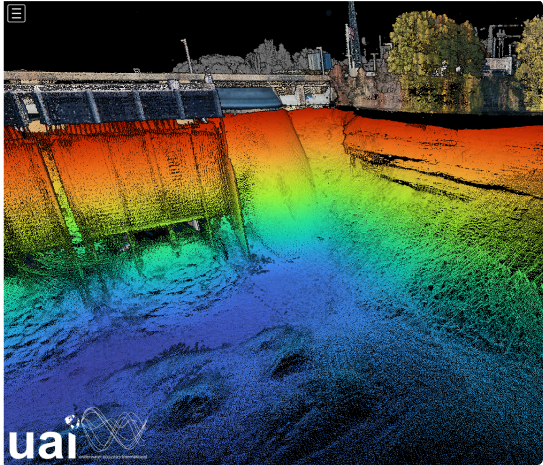
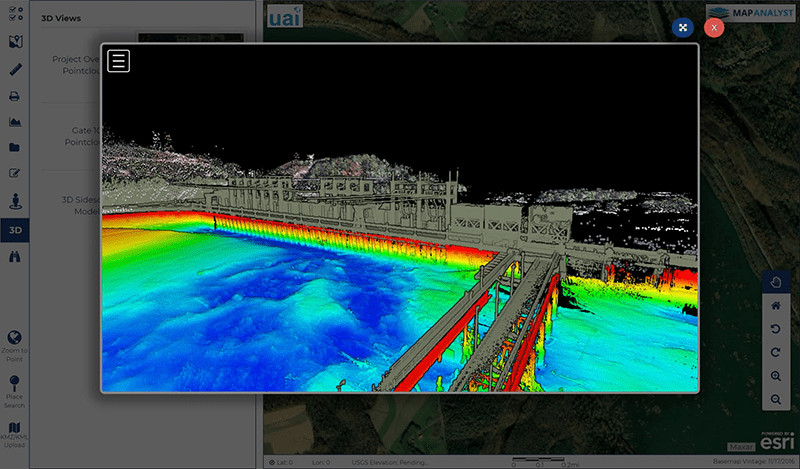
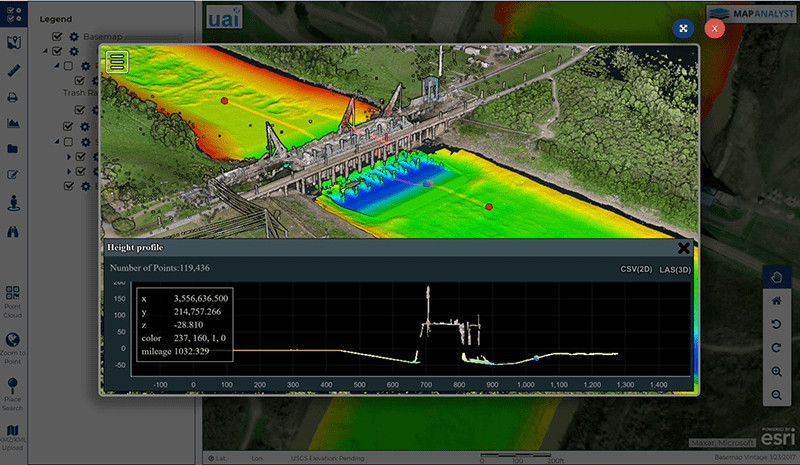
State-of-the-Art 2D and 3D Project Data Visualization
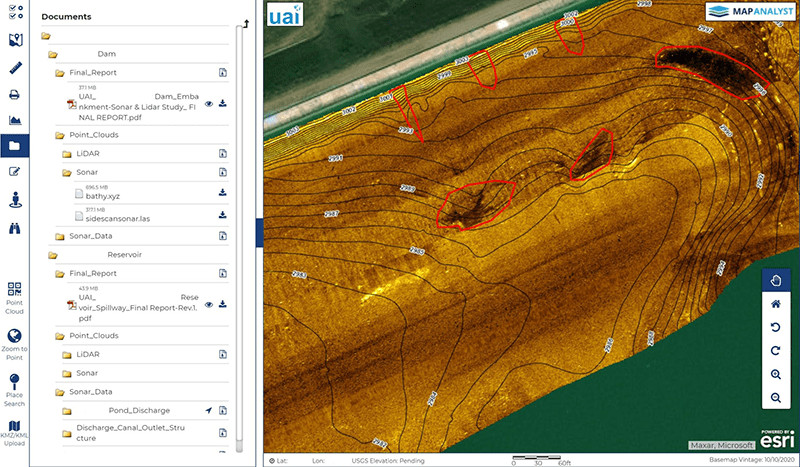
Integrated Document Management System for all Project Data
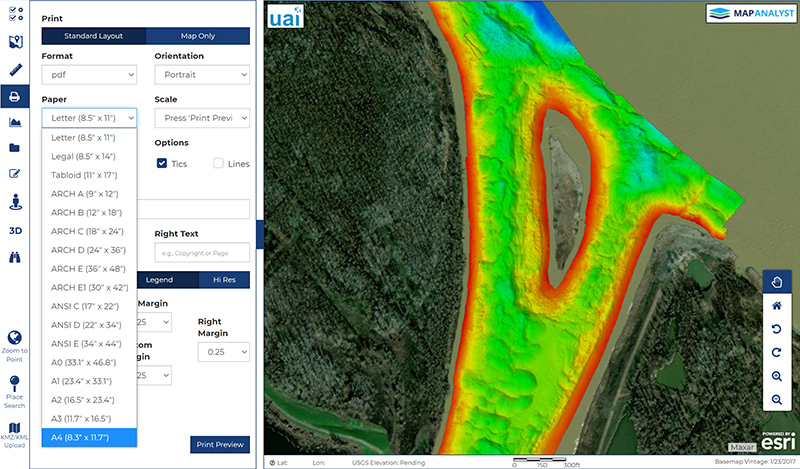
Printing to Scale, A to E Size
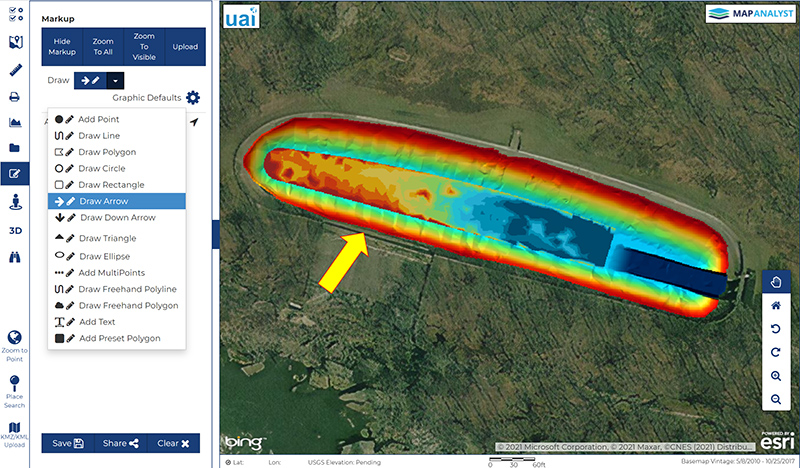
Shareable Annotation and Markup Tool
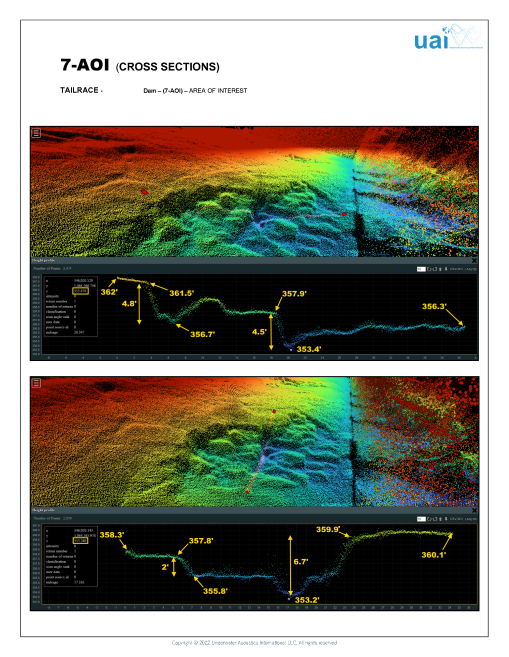
Robust toolkit for 2D and 3D measurement and cross-sectioning
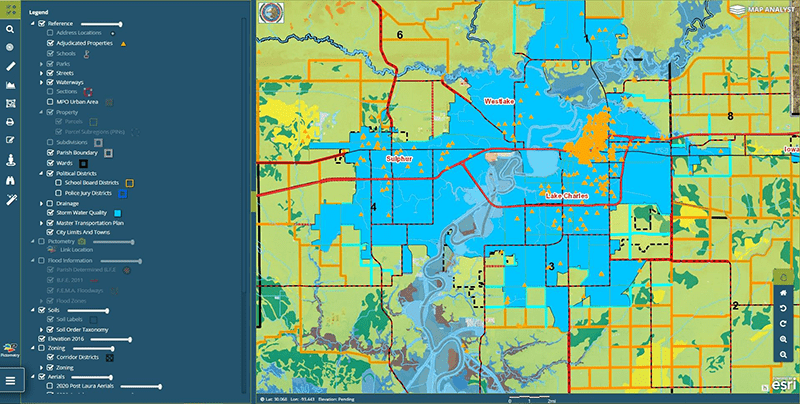
Easily add additional GIS Layers
Secure and Easy to Use Interface using any Browser
State-of-the-Art 2D and 3D Project Data Visualization
Integrated Document Management System for all Project Data
Printing to Scale, A to E Size
Shareable Annotation and Markup Tool
Robust toolkit for 2D and 3D measurement and cross-sectioning
Easily add additional GIS Layers